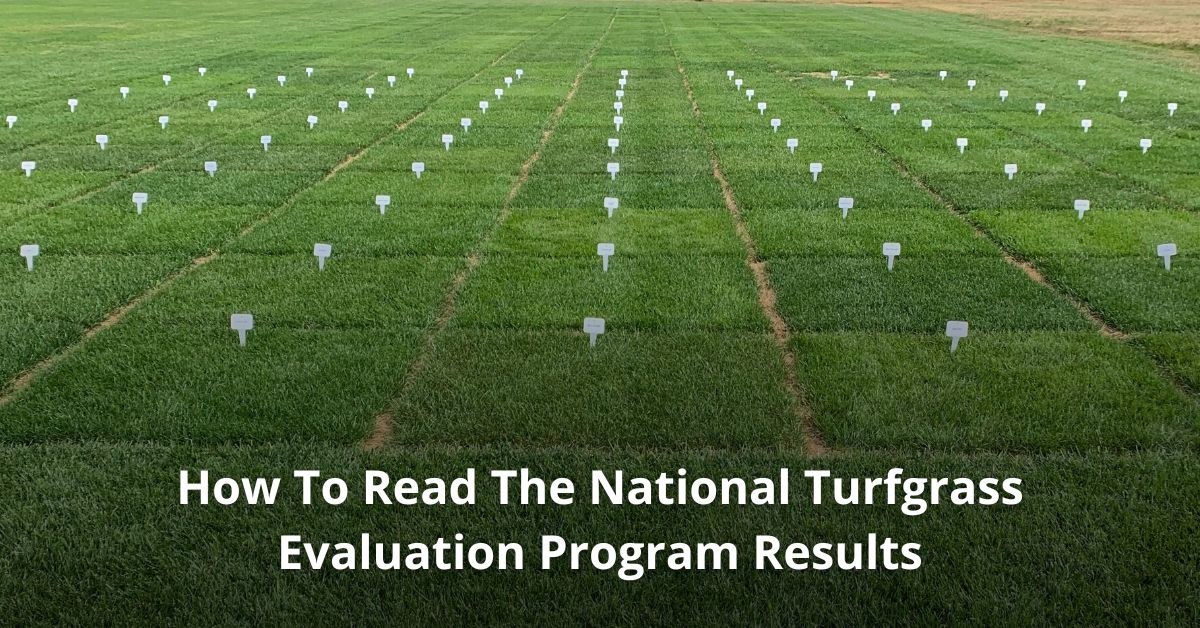
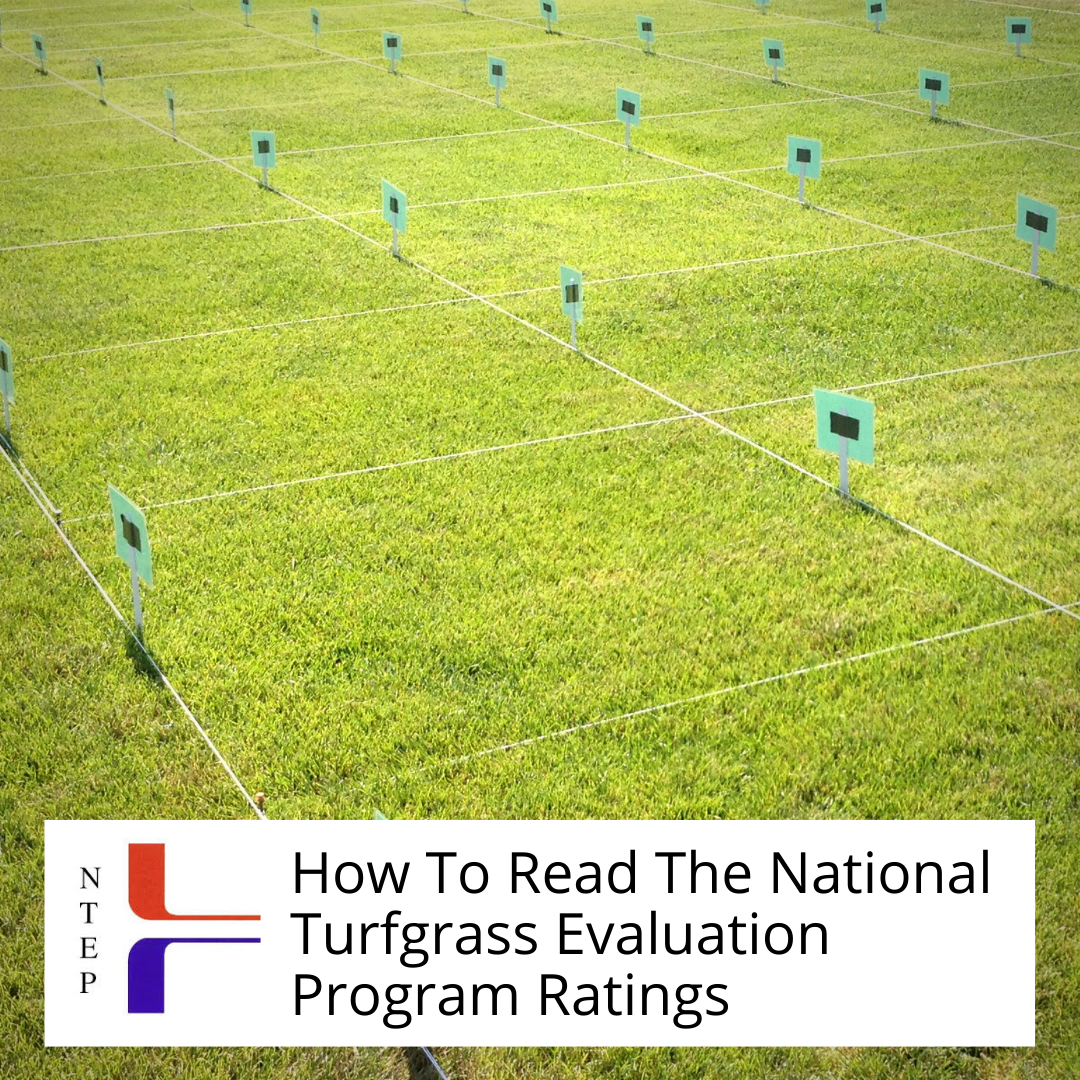
This is a guide* to explain some of the traits included in the National Turf Evaluation Program (NTEP) ratings, how they are evaluated and what the results mean with respect to end user groups. Most of the ratings are on a scale from 1-9 with 1 being the worst and 9 being the best.
This doesn’t always mean that 9 is the rating you want for some traits. Below I will explain where you don’t want to be in the top statistical group for some traits.
Least Significant Difference (LSD)
One important way to determine the value of a data point is to look at not only the LSD (larger LSD is indicative of data that is not as valuable) but also to look at the size of the top statistical group and how variable the trait is from year to year.
Those can indicate that the trait is not especially important in a species or that there were issues with the particular rating or trial location.
Click the first image below to see a quick slideshow of this blog post.
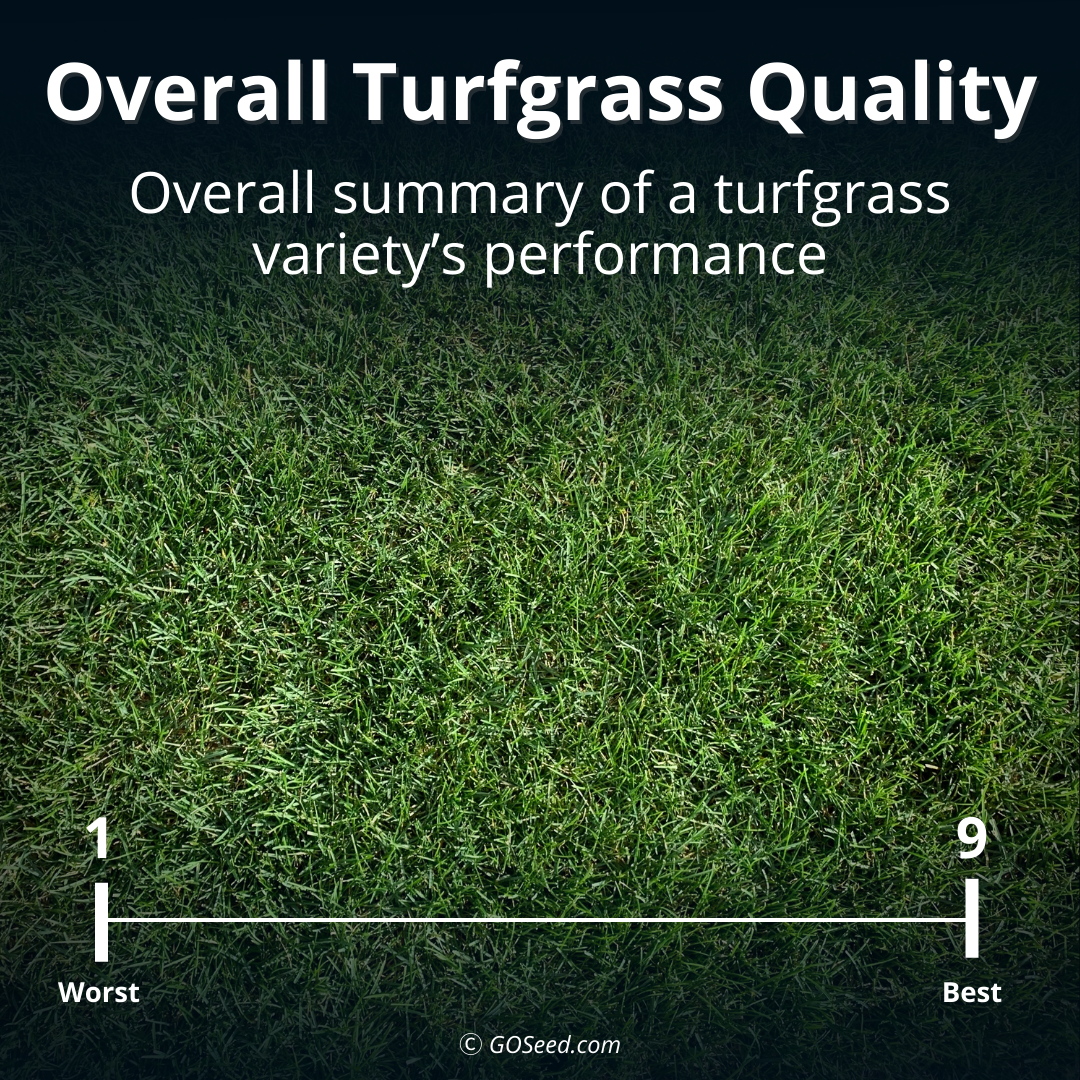
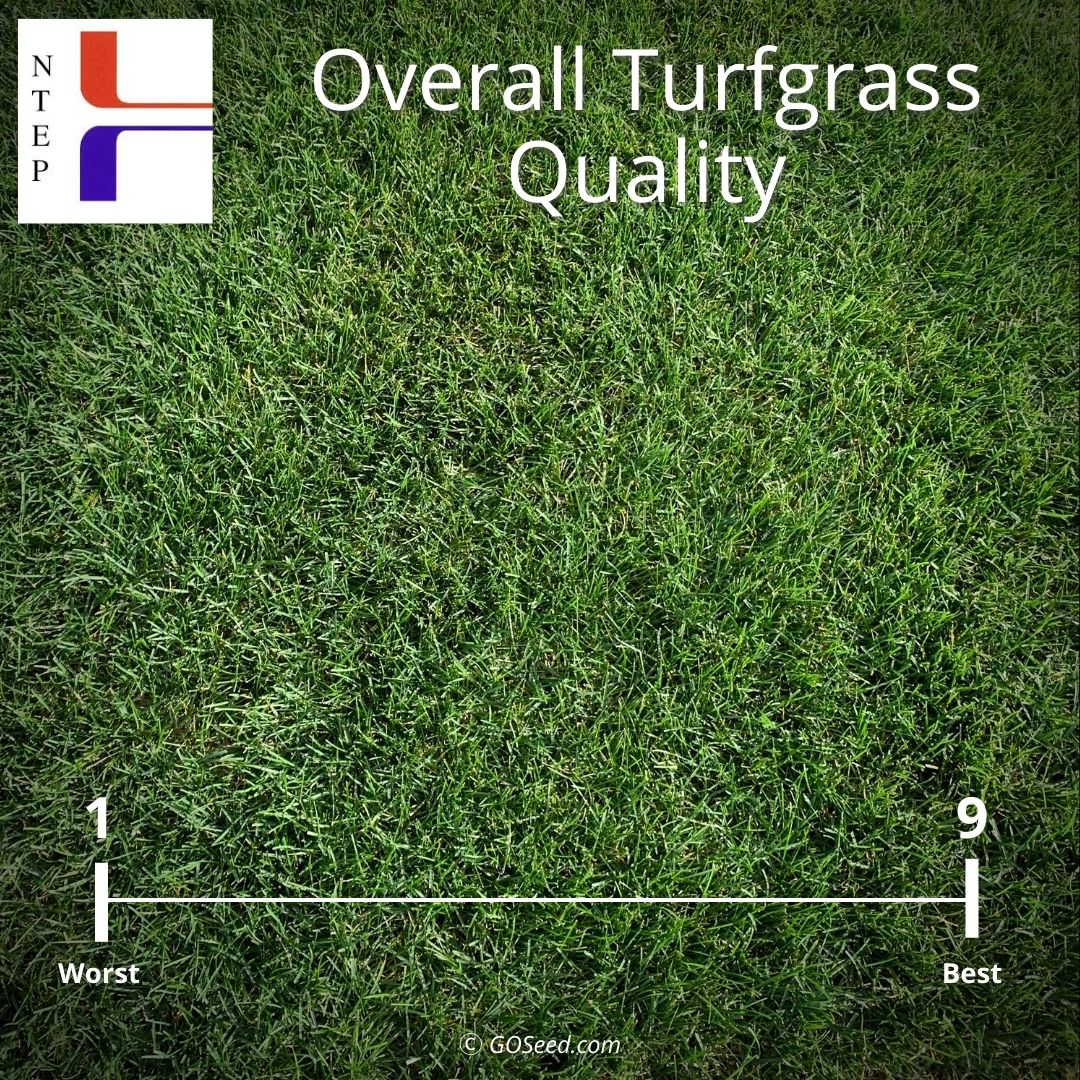
Turfgrass Quality
Turfgrass quality is an overall summary of a turfgrass variety’s performance. It takes into account color, density, texture, uniformity, disease resistance, and overall vigor of the plot.
It is a good measure of performance. This is a subjective rating and can be heavily influenced by the individual that is rating the trial.
Some raters may give more weight to density or uniformity than say color or texture for example. Another consideration regarding turfgrass quality is the same score does not necessarily mean the plots are similar. One plot could be rated a 5 because it has dark color and good texture but lacks density and uniformity while another plot could be rated a 5 for quality because it is very dense and uniform but has coarse texture and lighter green color. A high average or top statistical group turfgrass quality rating does indicate that the variety is overall good or one of the best in the trial.
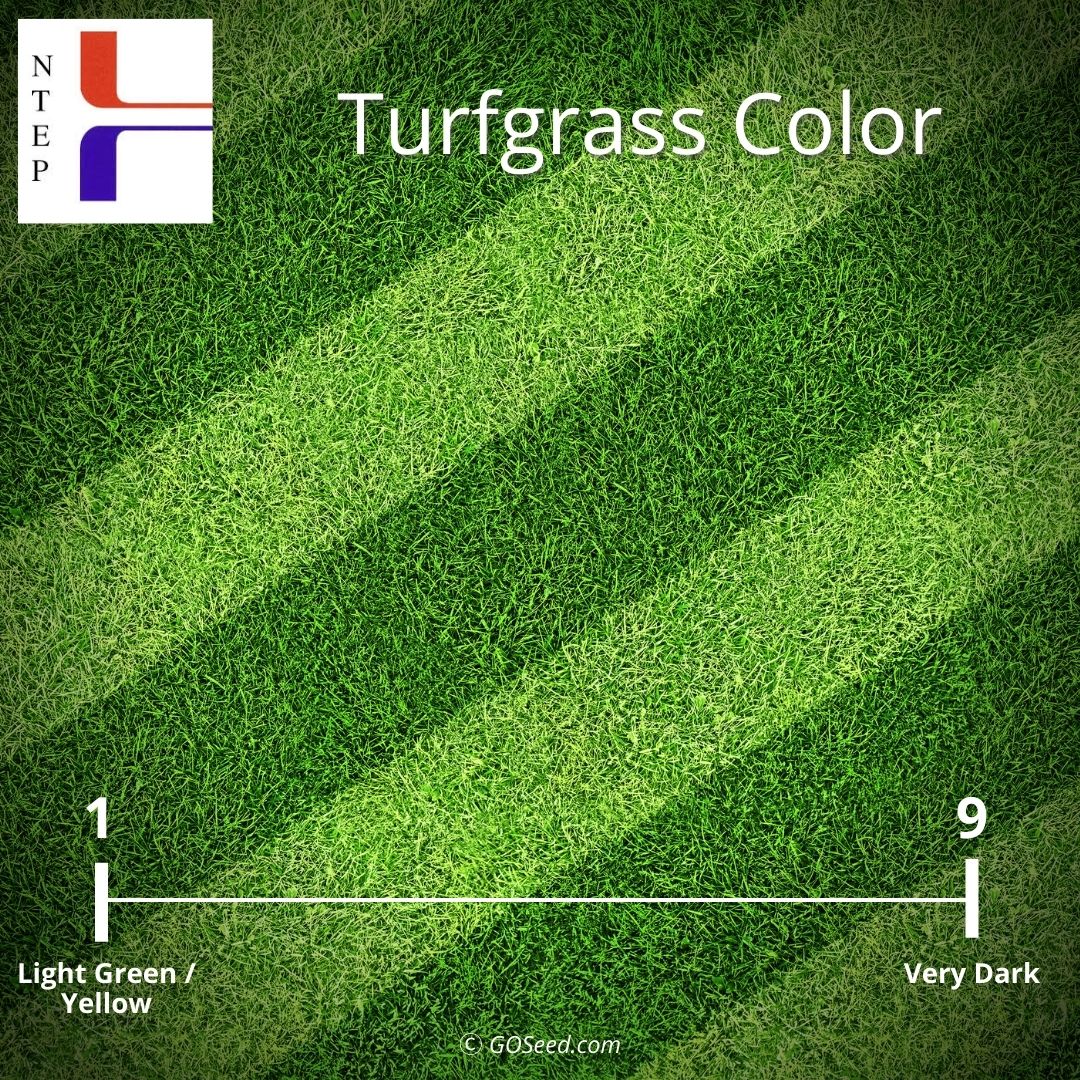
Turfgrass Color
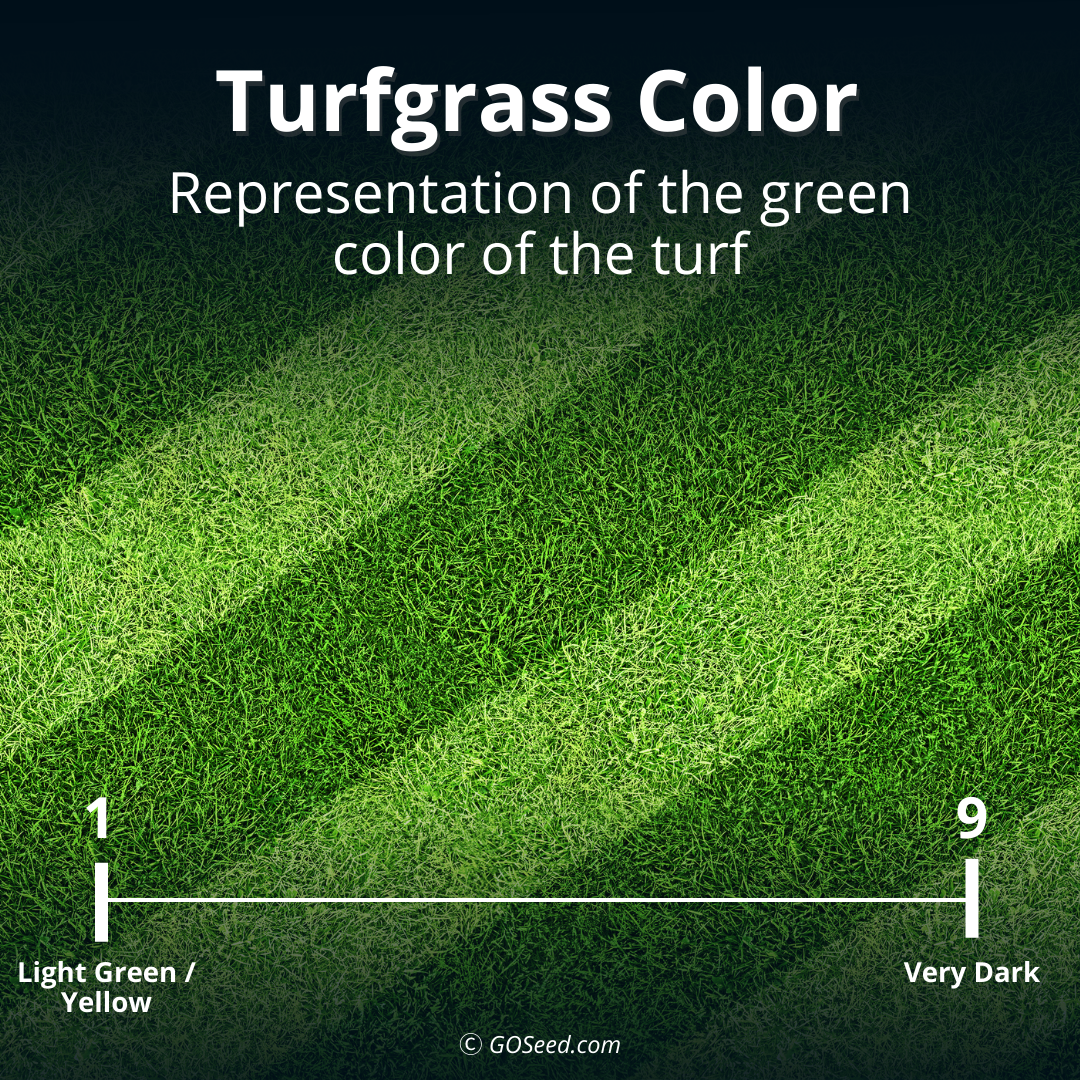
Turfgrass color has multiple ratings (genetic color and seasonal color). Genetic color is rated when the turf is actively growing and not under stress. It is a representation of the green color of the turf from very dark to yellow/green. Genetic color does not take into account chlorotic/necrotic tissue. Even though on the scale 9 is very dark and that is the best rating, I do not put a lot of value in being in the top statistical group for this trait. Darker is not always best and it depends on the wants and preferences of the end user for color. I feel a good vibrant medium green is more desirable that the ultra-dark or yellow/green varieties. One area where color is important is when coming up with seed blends. It is important to pick varieties of similar color to blend together.
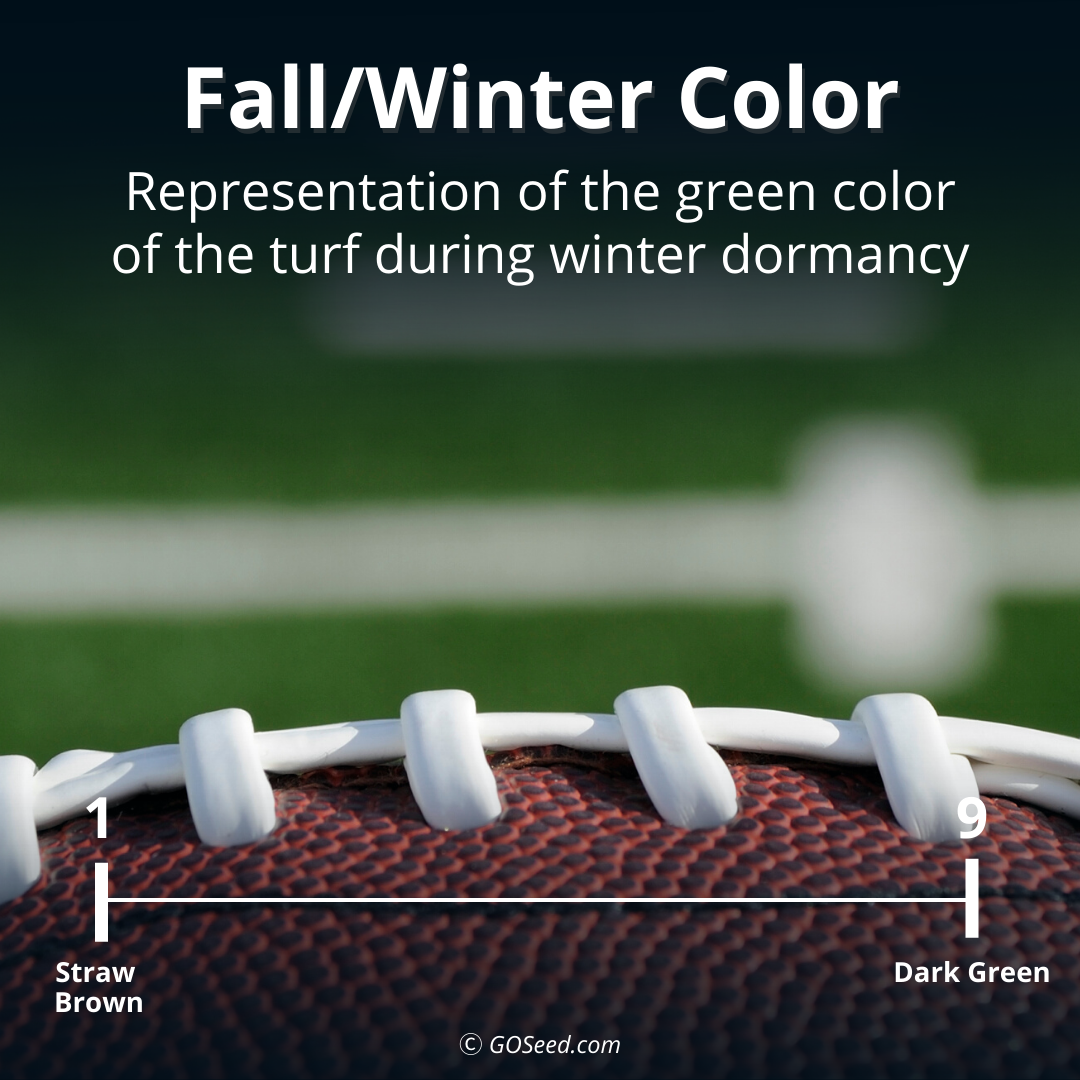
Winter color, Seasonal color, color retention on the other hand does take into account for chlorotic/necrotic tissue. Seasonal color and color retention ratings are a measure of overall plot color. The scale used is 1 to 9 scale with 1 being straw brown and 9 being dark green. Seasonal color can be used to successfully differentiate color differences based on damage caused by disease or insect pests, nutrient deficiency, or environmental stress. Color retention is used to assess the ability of the entry to hold color as seasons change. For example, many bluegrasses go dormant in the winter and turn a straw color. These would have a poor rating for winter color while many bluegrasses that do not go dormant and stay green would rate much higher. Seasonal color is an important trait for end users to consider especially if their turf has a seasonal use.
For example, a football field manager would not want to choose a variety that has poor fall color, but they may not be concerned about spring color, while a baseball field manager will want a variety that has good color in spring, summer, and fall.
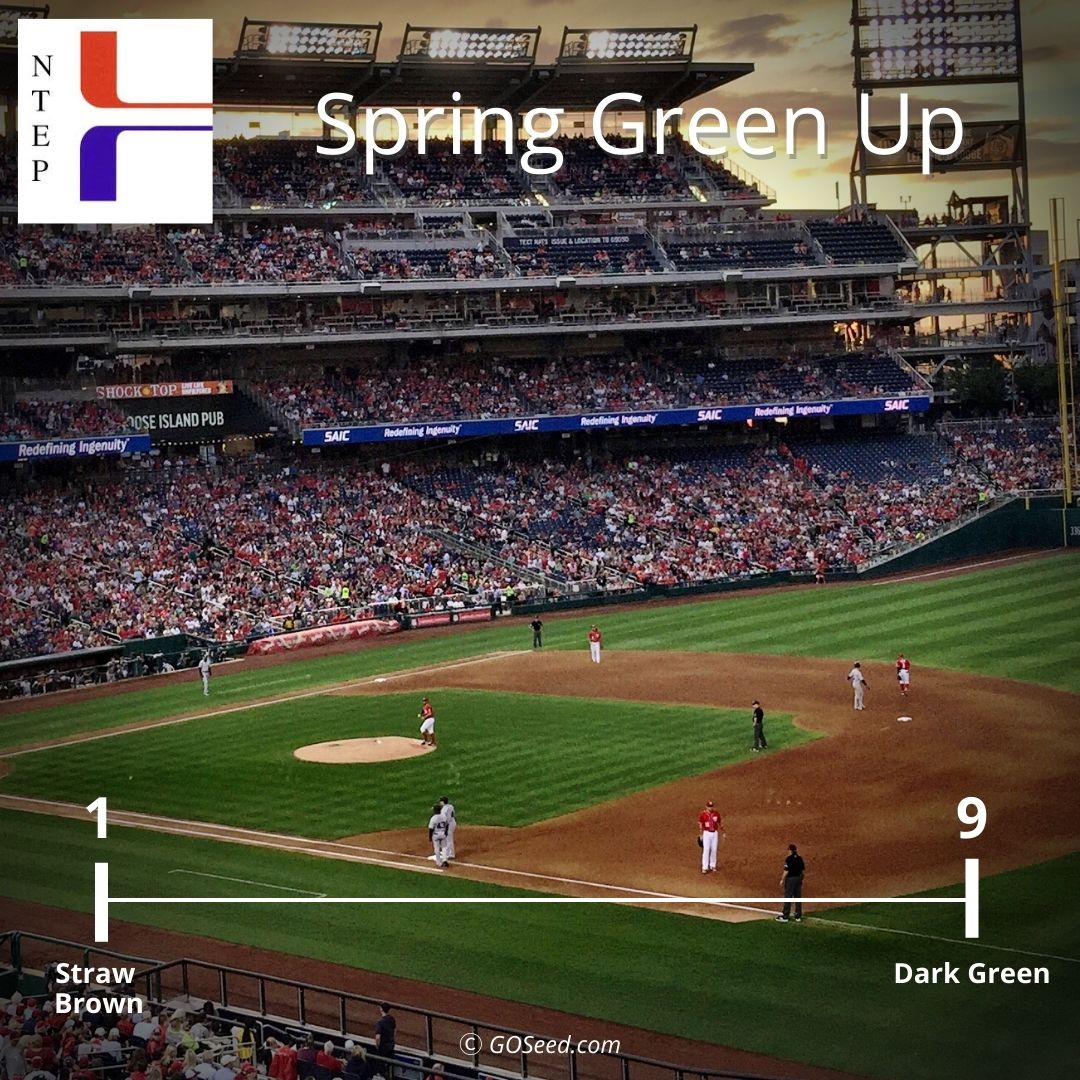
Spring green-up
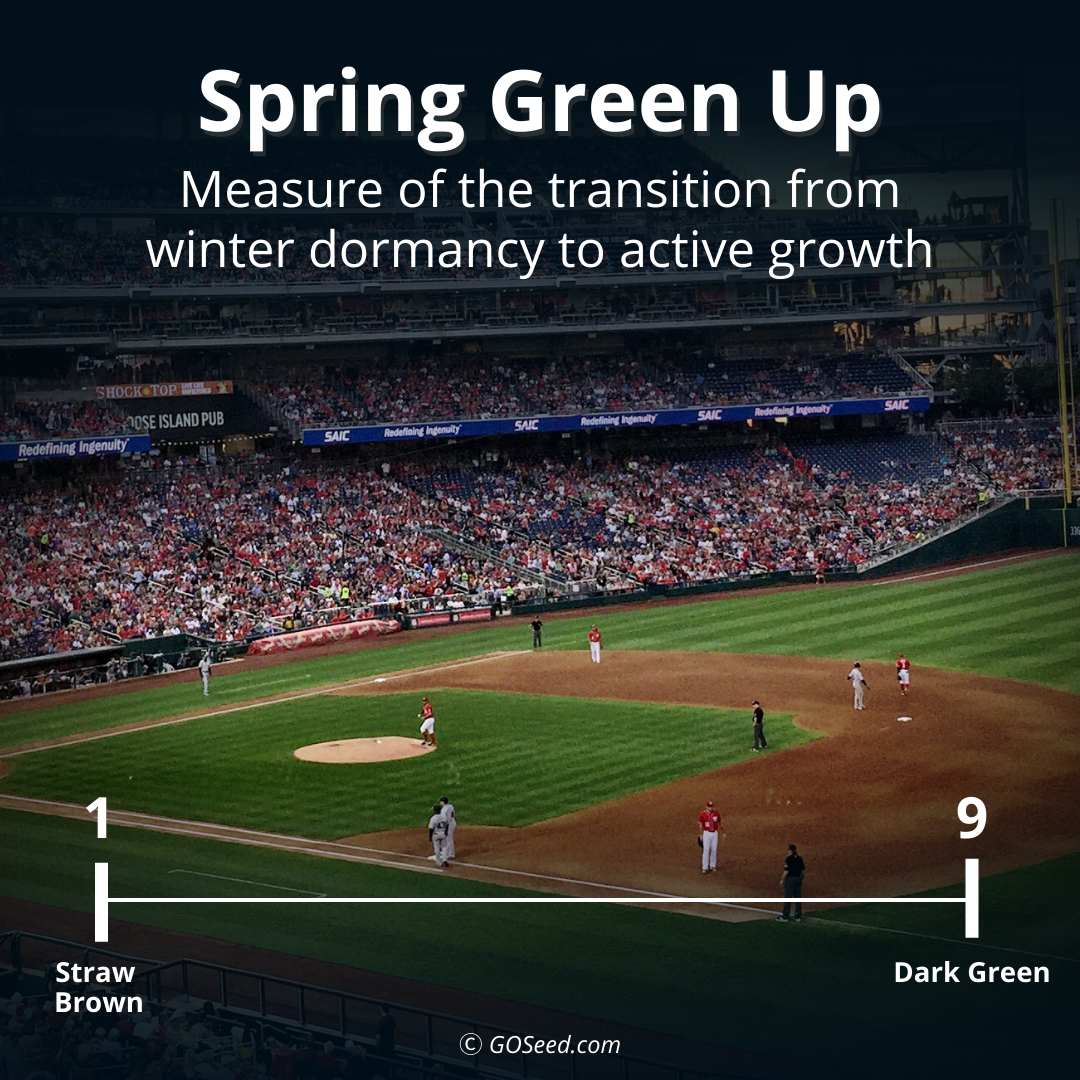
Spring Greenup is a measure of the transition from winter dormancy to active spring growth.
It is based on plot color not genetic color. The visual rating of spring green-up is based on a 1 to 9 rating scale with 1 being straw brown and 9 being completely green.
This rating takes into account when the grass “wakes up” from winter dormancy and starts to grow. The earlier the grass starts to grow the higher the rating.
This is especially important for many baseball field managers that host spring training. A variety that is slow to start growing after winter dormancy will be unsightly (straw colored etc.) and can sustain a lot of wear damage from continuous play when the grass is not growing and actively recovering.
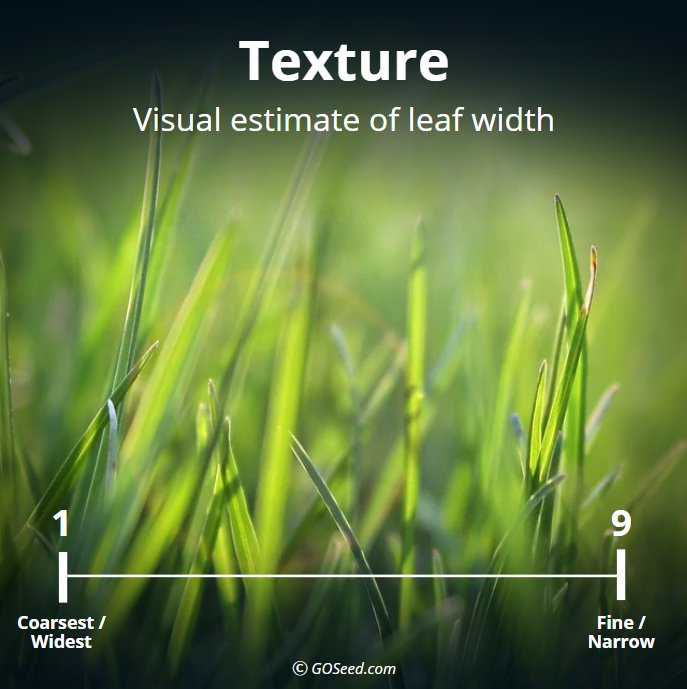
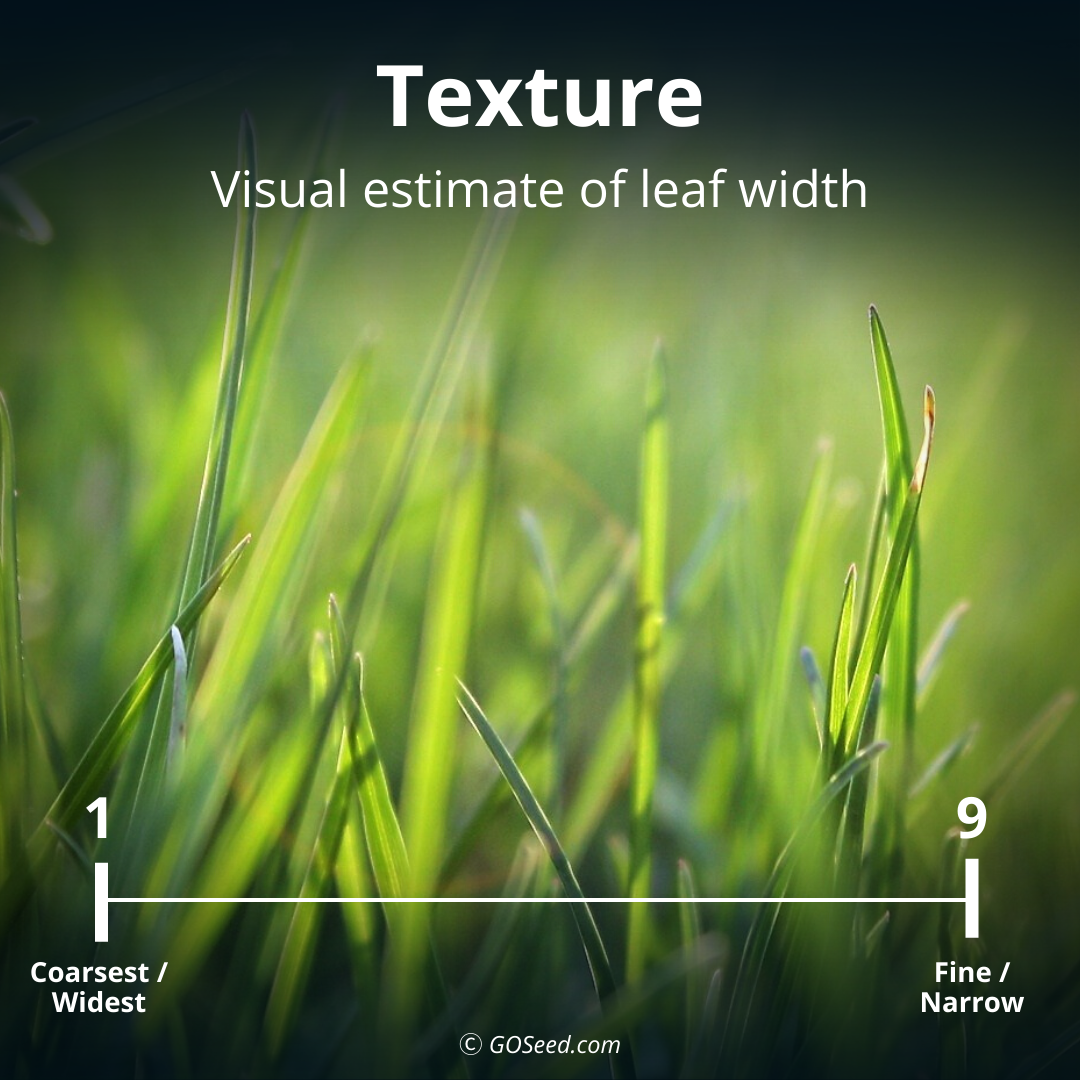
Texture
Texture ratings are a visual estimate of leaf width. The rating is 1-9 with 9 meaning the finest or most narrow leaf widths and 1 being the coarsest or widest leaf width.
Finer texture or having narrower leaves is more aesthetic but a variety that is not in the top statistical group for texture does not mean that it is bad.
Anything from medium to fine texture is desirable and it really depends on the preference of the end user. One aspect of texture to be cognizant of is picking components of a blend.
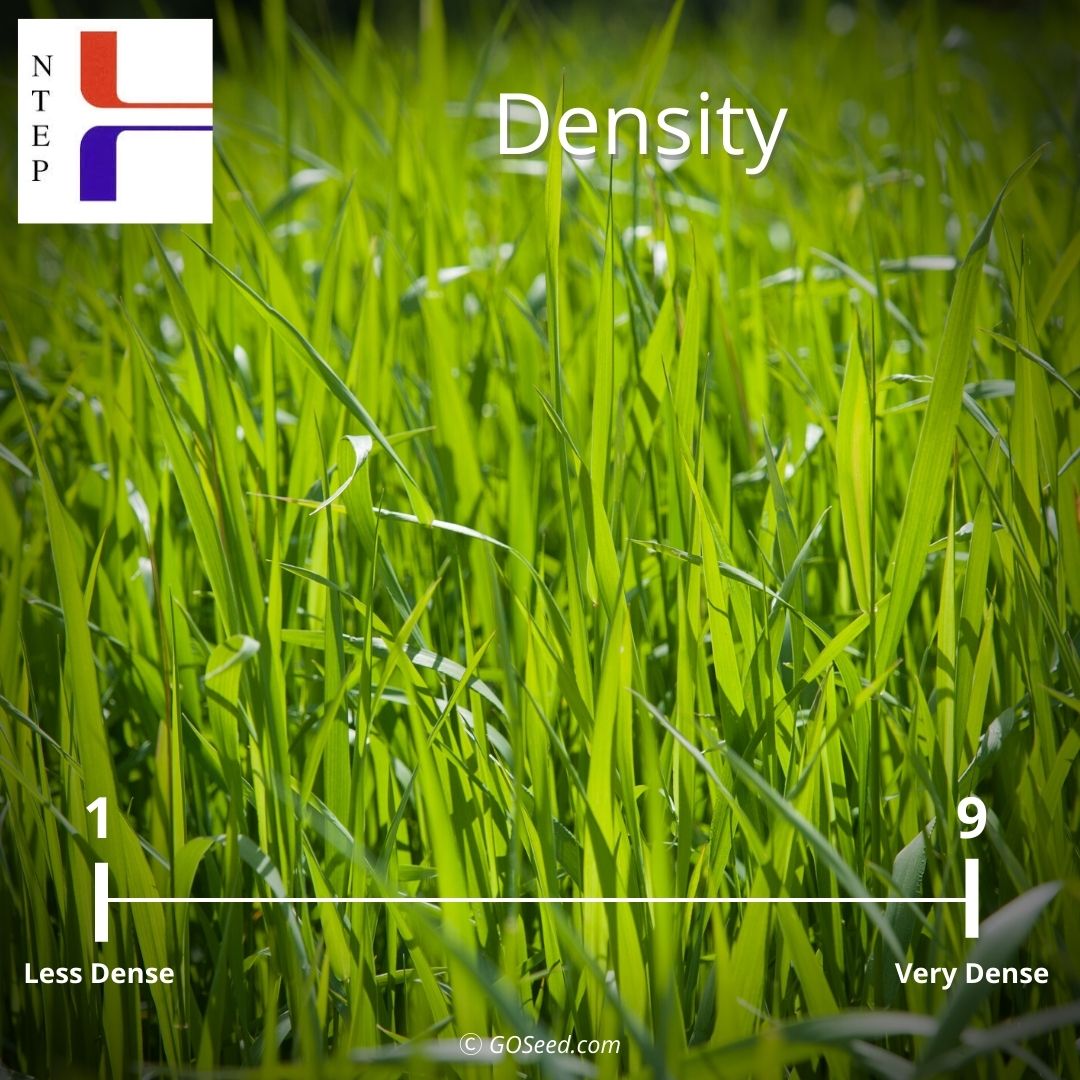
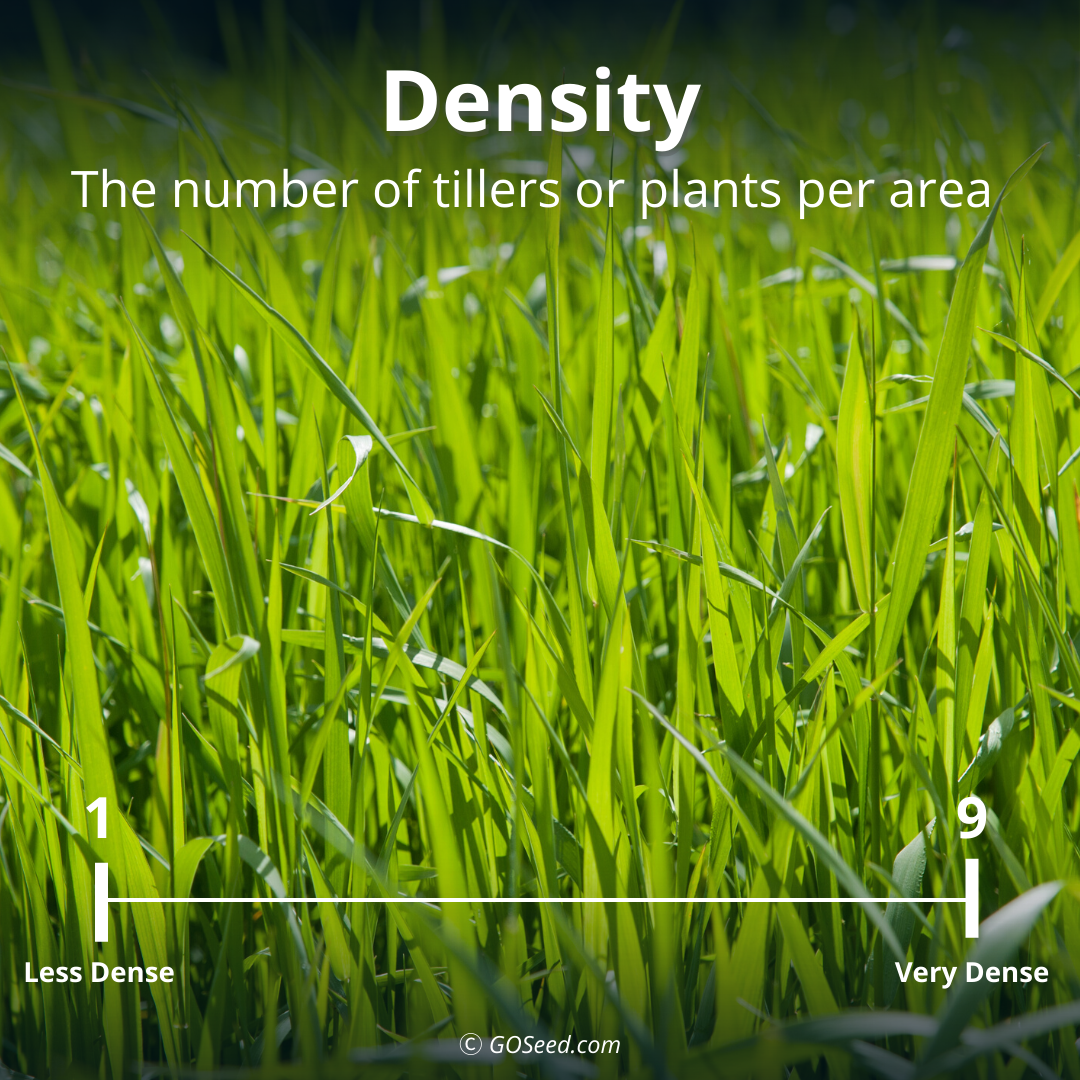
Density
Density is a rating that estimates the number of tillers or plants per area. The rating is 1-9 with 9 being the highest density or highest number of tillers in a given area.
Turfgrass density can vary seasonally especially in cool-season grasses. Having good density during the season/s that the turf will be utilized is important and having good density across all seasons demonstrates a variety that maintains good density year-round.
Having high density can cause problems. Foliar diseases such as brown patch can become more problematic for very dense turf. This is likely due to prolonged canopy moisture retention which can create an environment for infection and prolific growth for pathogens.
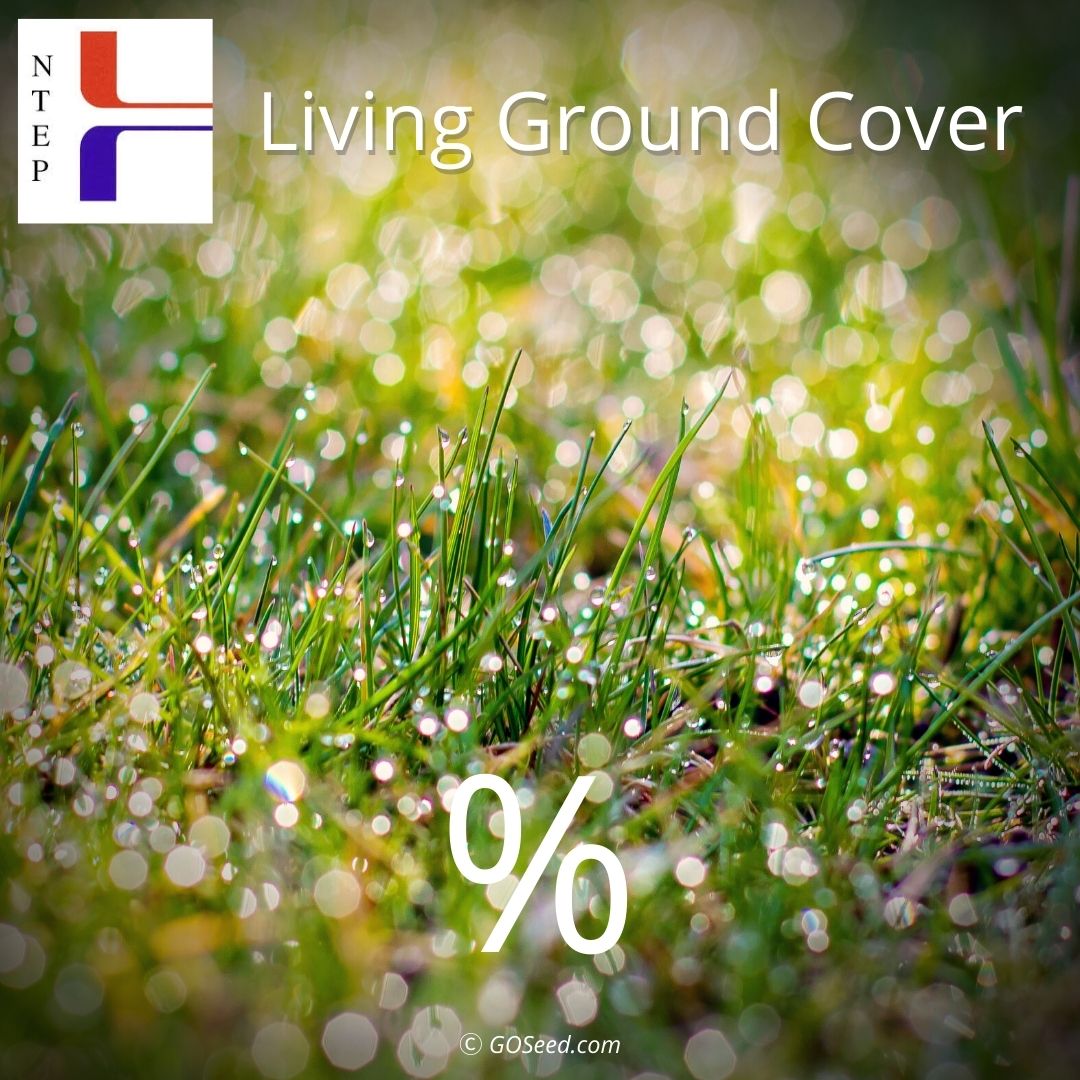
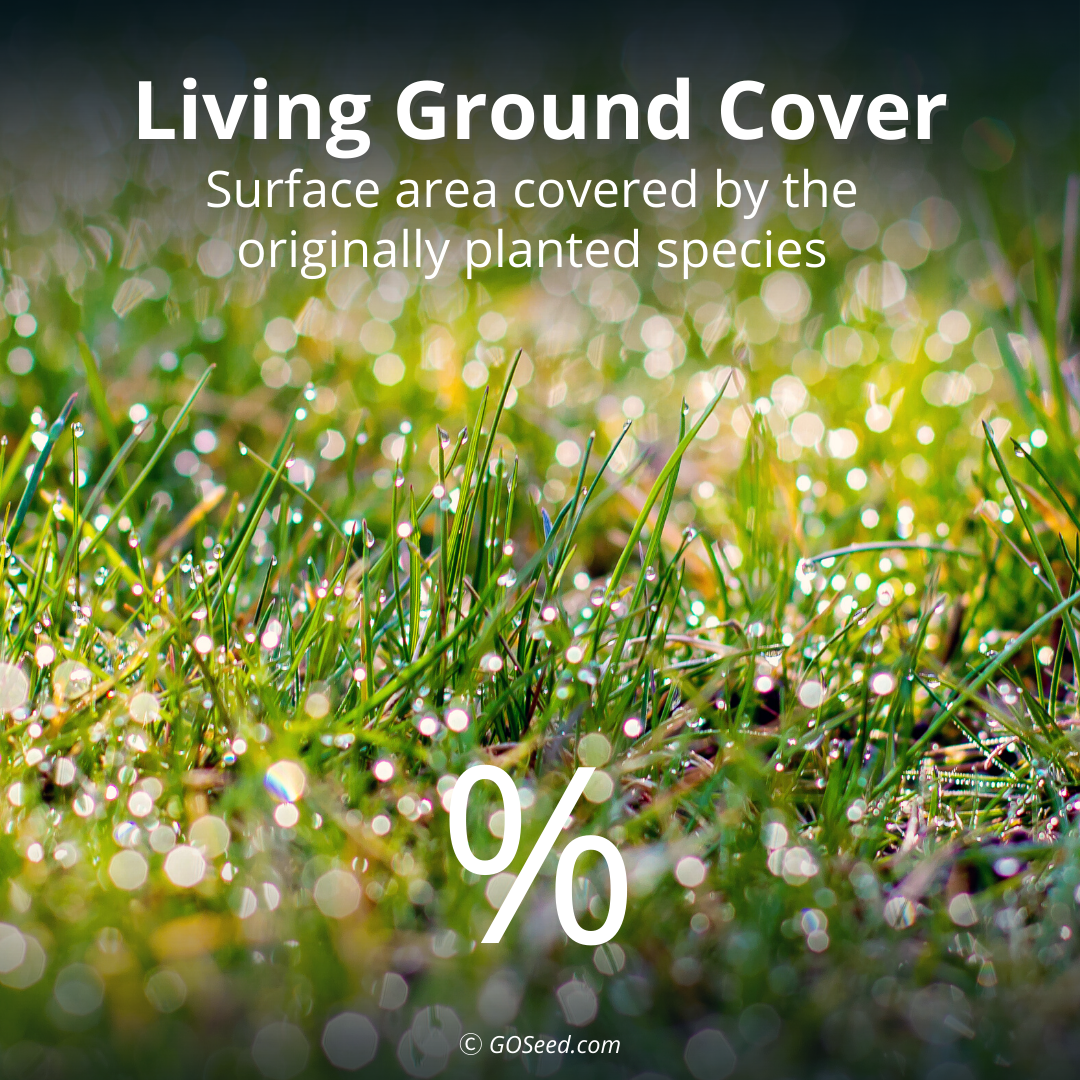
Living ground cover
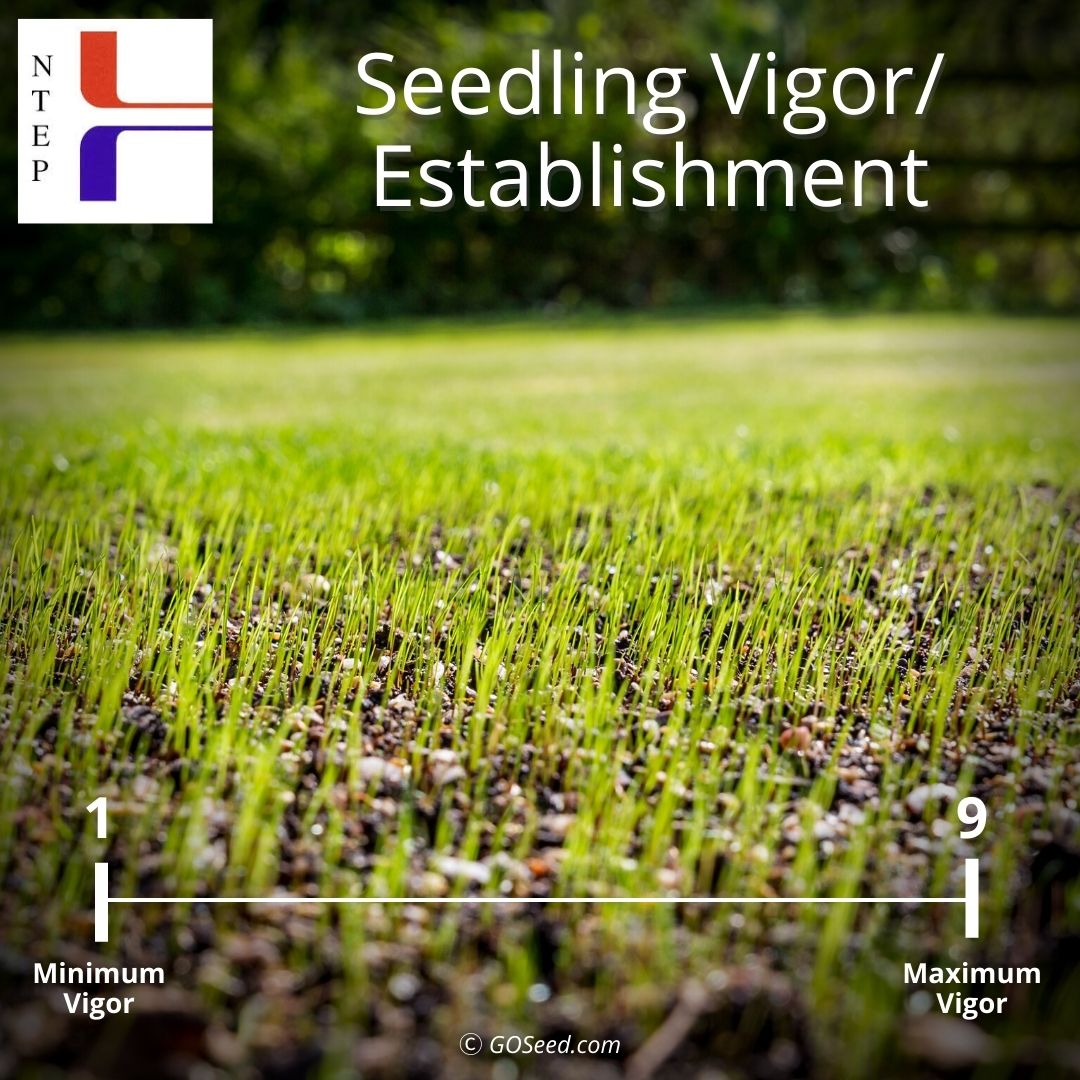
Seedling vigor/Establishment
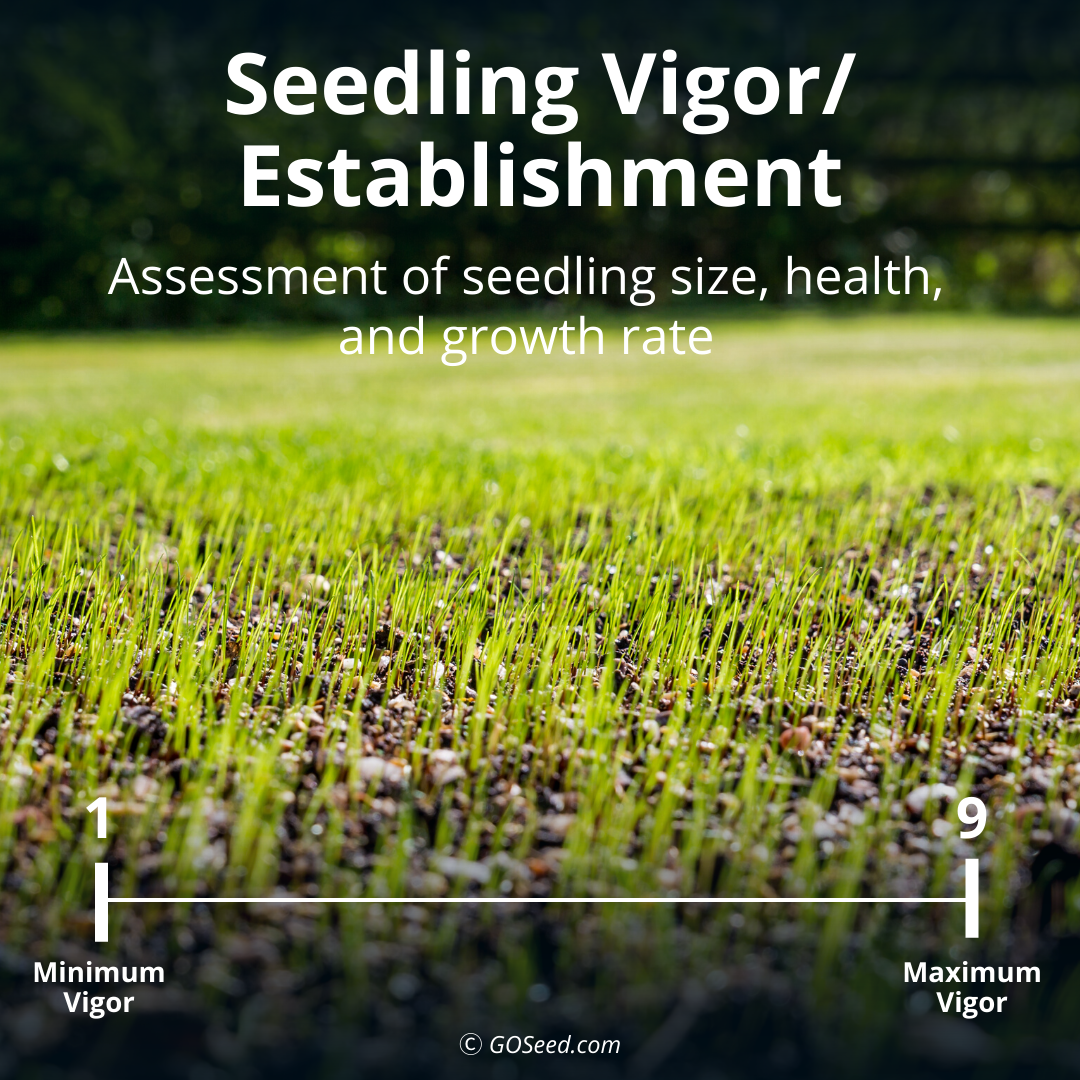
Seedling vigor is the visual assessment of seedling size, health, and growth rate. Establishment is a visual estimate of percent ground cover, plant height, etc. that reflects the relative speed the entry develops into a mature sod.
Seedling vigor is rated on a 1 to 9 scale with 9 equaling maximum vigor. Establishment is rated on a percentage coverage basis.
This trait is especially important for many end users especially for Kentucky bluegrass since it is slower to establish as a species. For sod farms the faster that the grass establishes then the sooner they can harvest sod.
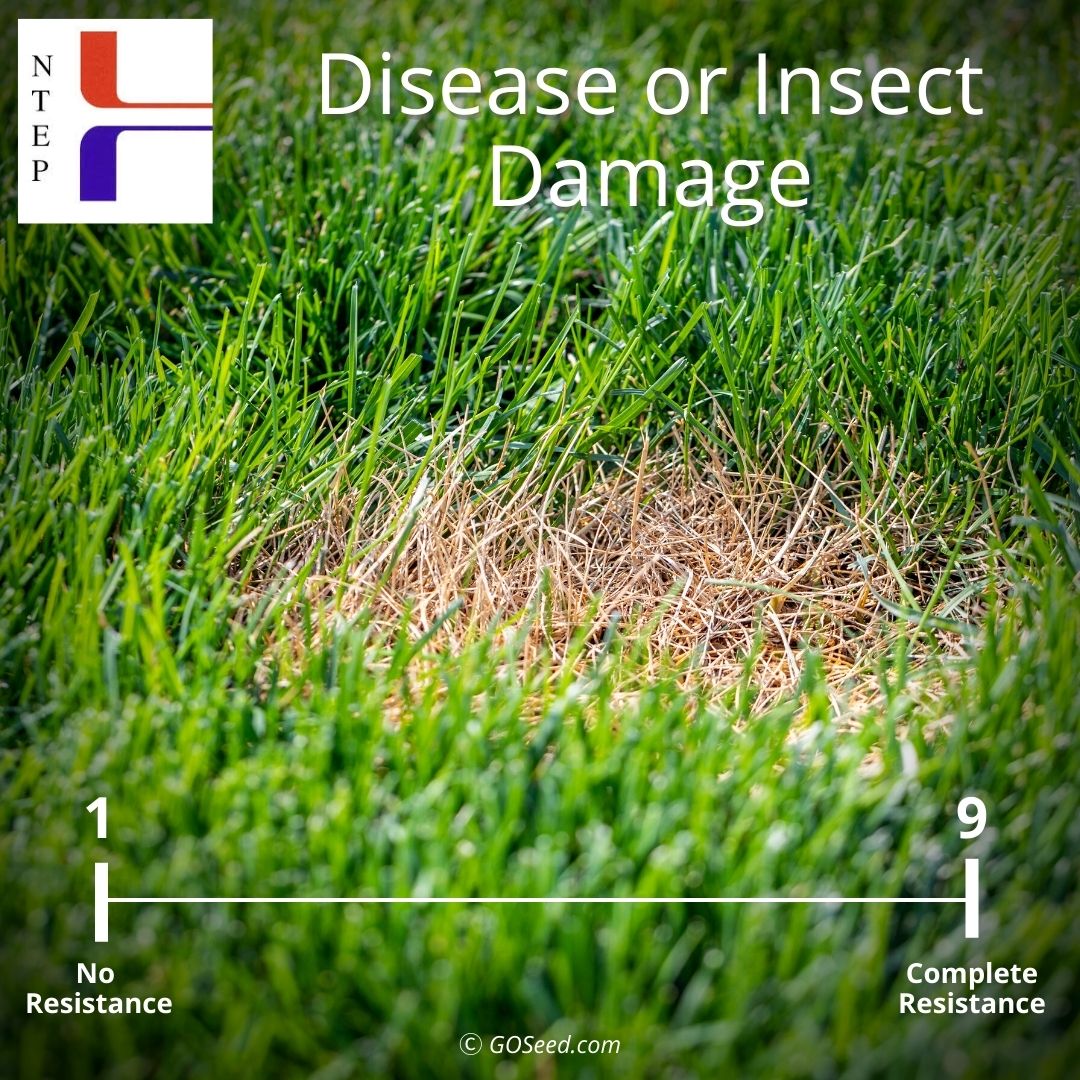
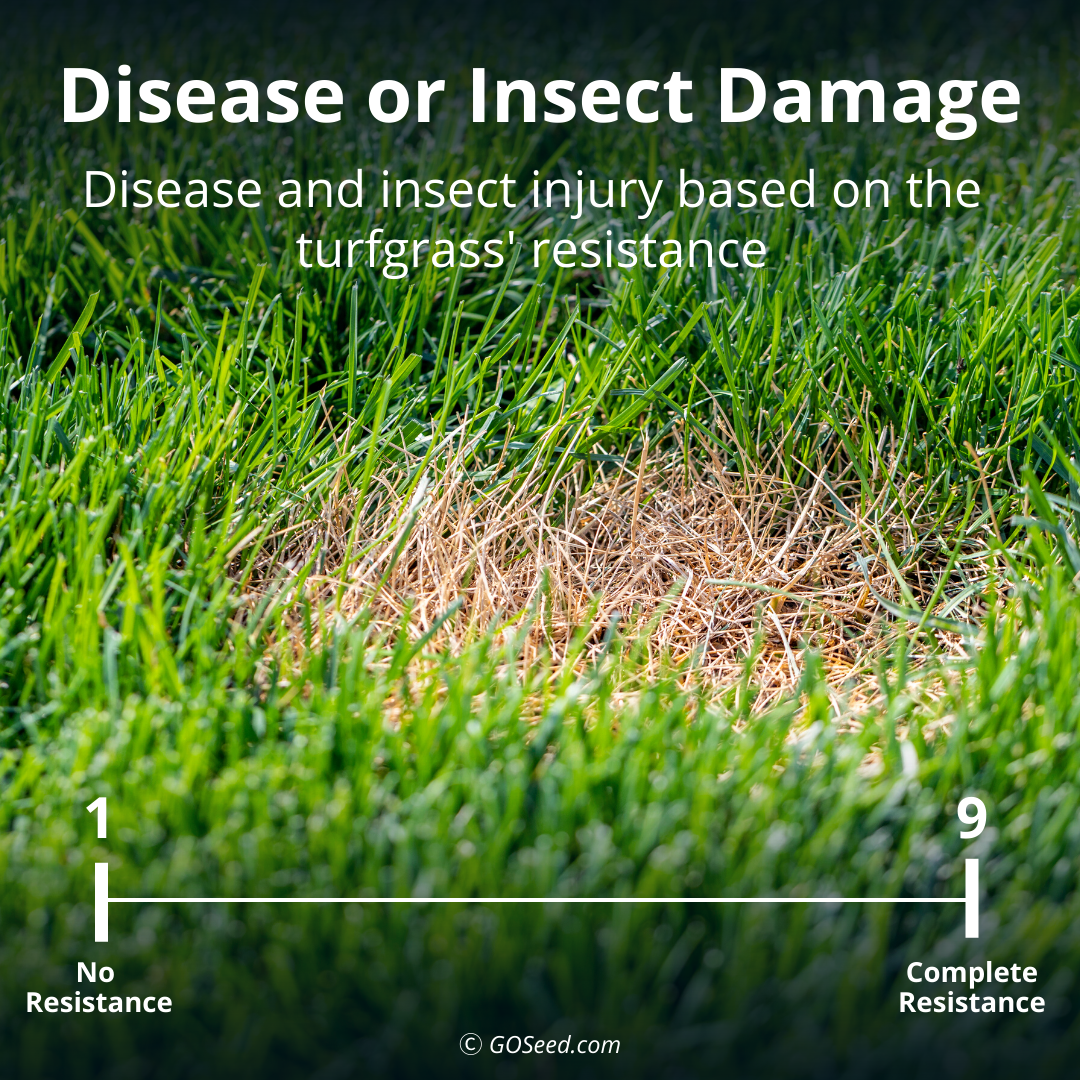
Disease or insect damage
Disease and insect injury are based on the turfgrass resistance and is rated using the 1 to 9 rating scale with 1 equaling no resistance or 100% injury, and 9 equaling complete resistance or no injury.
Insect incidence may also be determined as counts per unit area. The first defense against disease is genetic resistance.
One of my favorite quotes from the Agrios plant Pathology book is “The safest, most effective and least expensive way of controlling plant diseases is by the development and use of resistant cultivars.”
Dollar spot
Dollar spot, which is caused by Clarireedia jacksonii (in cool-season grasses), is a destructive foliar disease of cool-season and warm-season grasses. It infects perennial ryegrass, fine fescues, Kentucky bluegrass, and tall fescue to a lesser degree. This disease can create large areas of dead turf in stand. Dollar spot is the most common disease of cool-season turfgrass.
It was reported that more money is spent to control dollar spot than any other turfgrass disease.
Grey leaf spot
Pyricularia oryzae infects more than 50 species of grasses including annual ryegrass, perennial ryegrass, rice, St. Augustinegrass, tall fescue, and hard fescue.
It is a very destructive foliar disease which Diseased turfgrass stands exhibit diffuse blighting symptoms and have a dull or wilted appearance. Affected turf will ultimately collapse and appear as sunken, irregularly shaped patches which can decimate entire turfgrass stands.
This disease can really have a detrimental effect on newly established stands of turfgrass that are planted in late summer. It is also becoming more of a problem in new locations like the PNW and California where it has not been much of a problem in the past.
Brown patch
Brown patch, which is caused by Rhizoctonia solani, is a soilborne disease of both cool-and warm-season turfgrasses that occurs during warm and humid weather conditions.
Brown patch symptoms include blighted, circular to irregularly shaped patches in the turf canopy, which quickly fade to a light brown color.
Brown patch is most problematic in tall fescue. There has not been any report of a tall fescue that is completely resistant to brown patch but there is a wide range of susceptibility to the disease. Highly susceptible varieties can have lasting effects from the disease which thins the turf and create irregular patches of dead turf.
Summer patch
Caused by Magnaporthiopsis poae is a very destructive disease that infects the roots of the grass. Kentucky bluegrass and hard fescue are the two species most susceptible to the disease.
There are varieties of Kentucky bluegrass that are resistant to summer patch. Infection occurs in on the roots and the symptoms (large sunken patches of wilting and dead turf) occur suddenly. This makes early detection and treatment exceedingly difficult.
Rust
Stem rust, which is caused by Puccinia graminis subsp. Graminicola, infects ryegrass, bluegrass, fine fescues and tall fescue and is typically a brick red in color.
Crown rust is caused by Puccinia coronata and is a yellow orange in color. It also infects Kentucky bluegrass and perennial ryegrass predominantly but also occurs in fine fescues and tall fescue.
Pink snow mold
Pink snow mold is caused by Microdochium nivale or formerly Fusarium nivale. This disease can be problematic in tall fescue and fine fescue.
Grey snow mold
Typhula blight infects all turfgrasses. NTEP reported ratings for this disease in Pennsylvania on tall fescue which showed a broad range of susceptibility of the varieties in that trial.
Leaf spot
Bipolaris and Drechslera are the causal agents of different seasonal leaf spots that occur on many cool-season turfgrasses. They can be particularly destructive in the fine fescues (especially Chewings and strong creeping red fescue), perennial ryegrass and tall fescue.
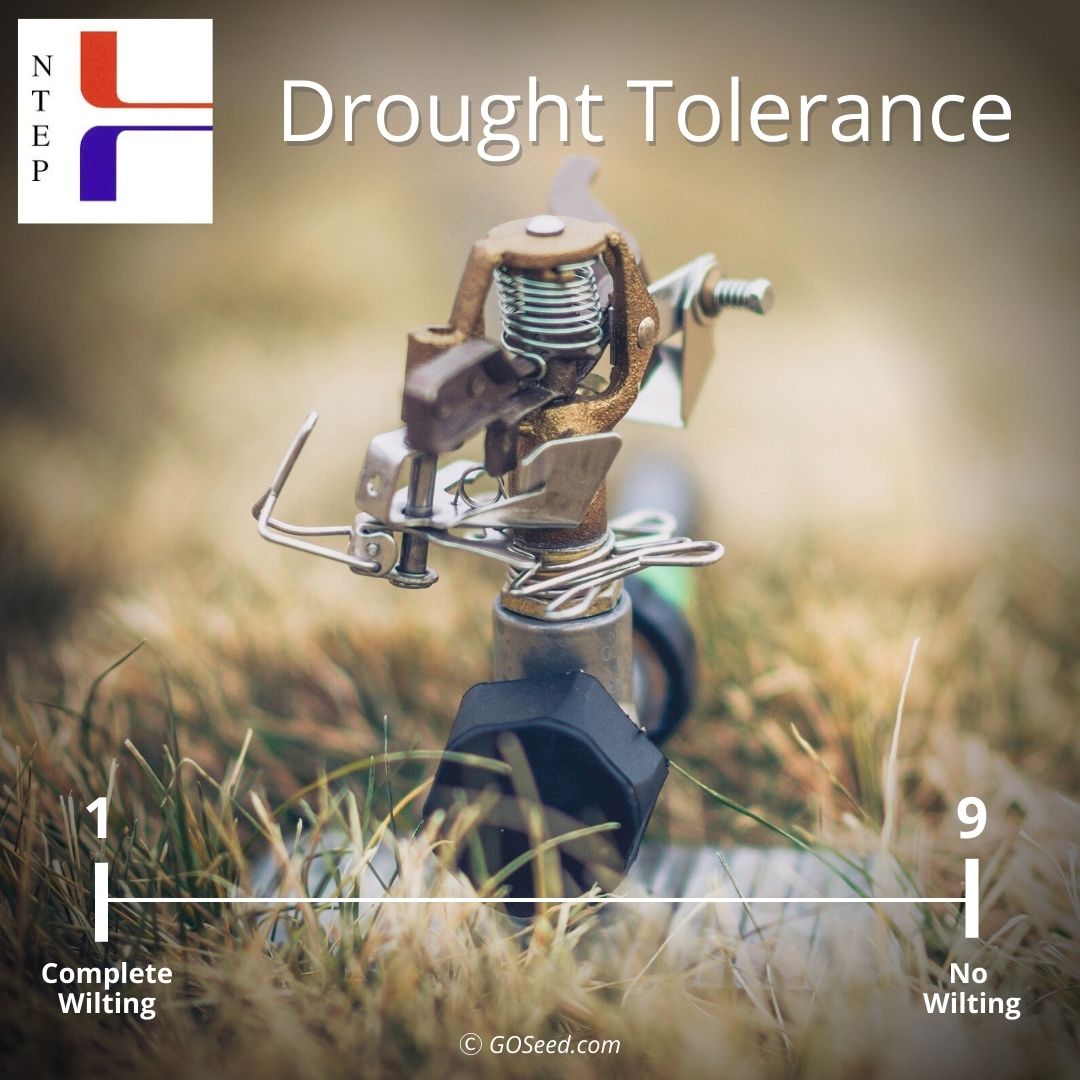
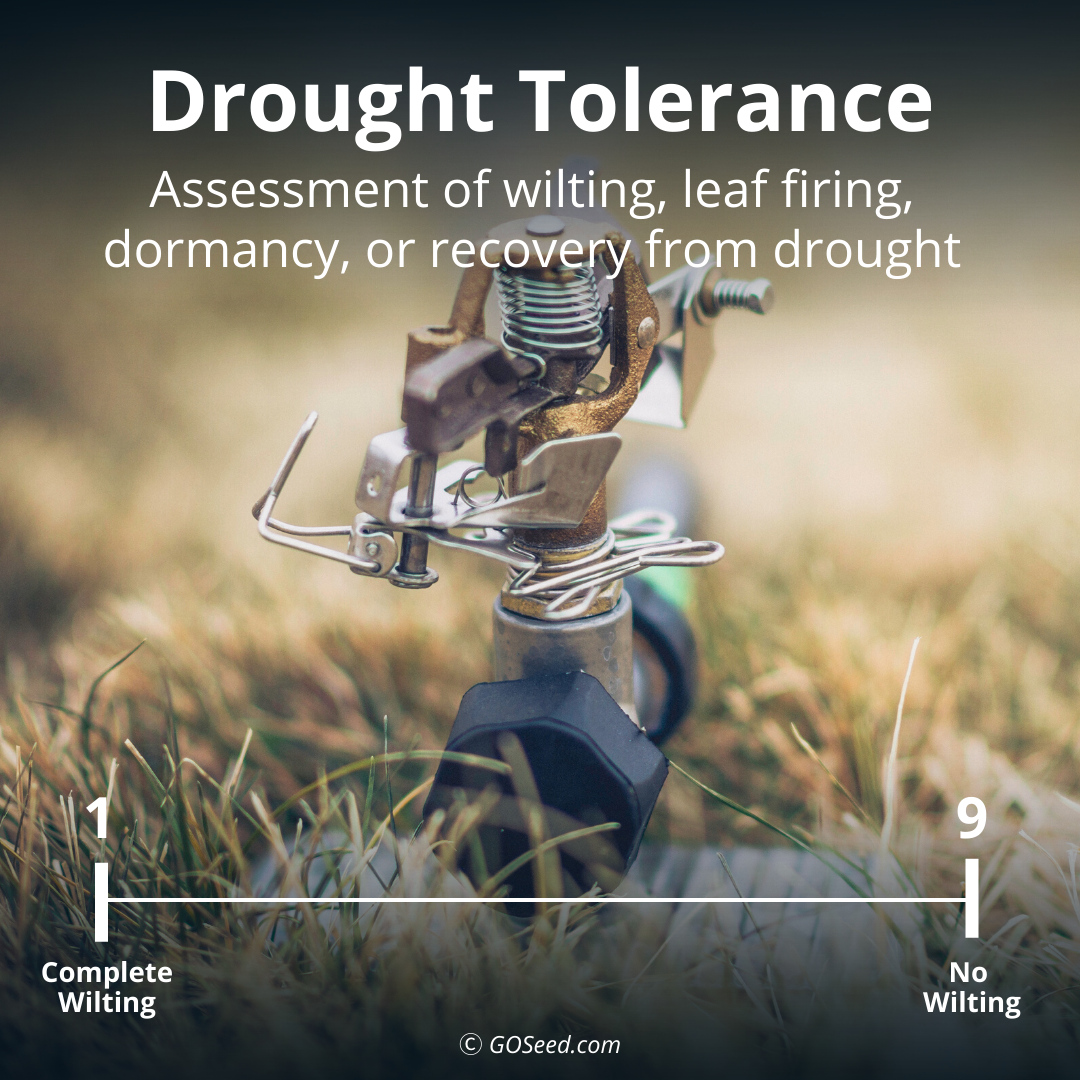
Drought tolerance
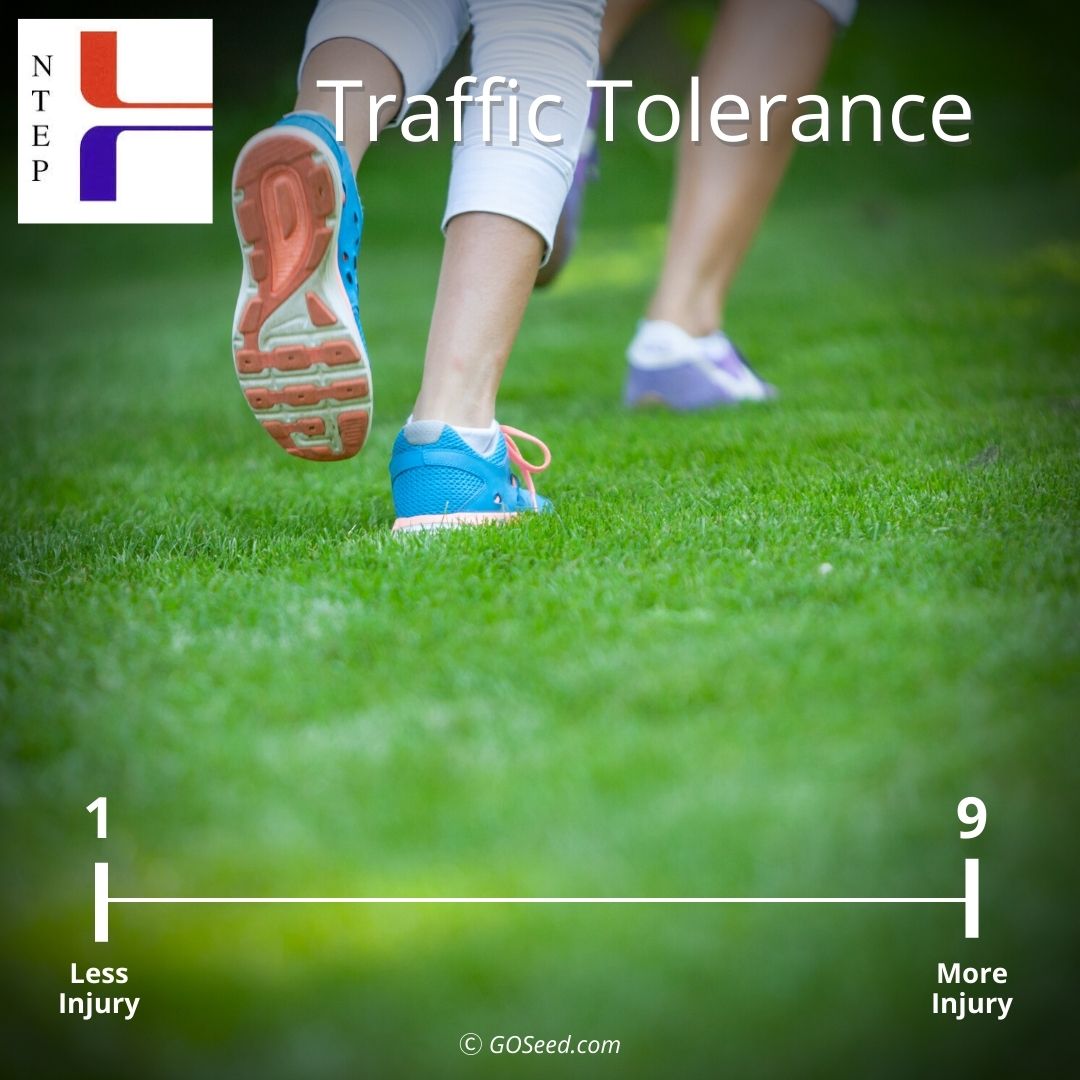
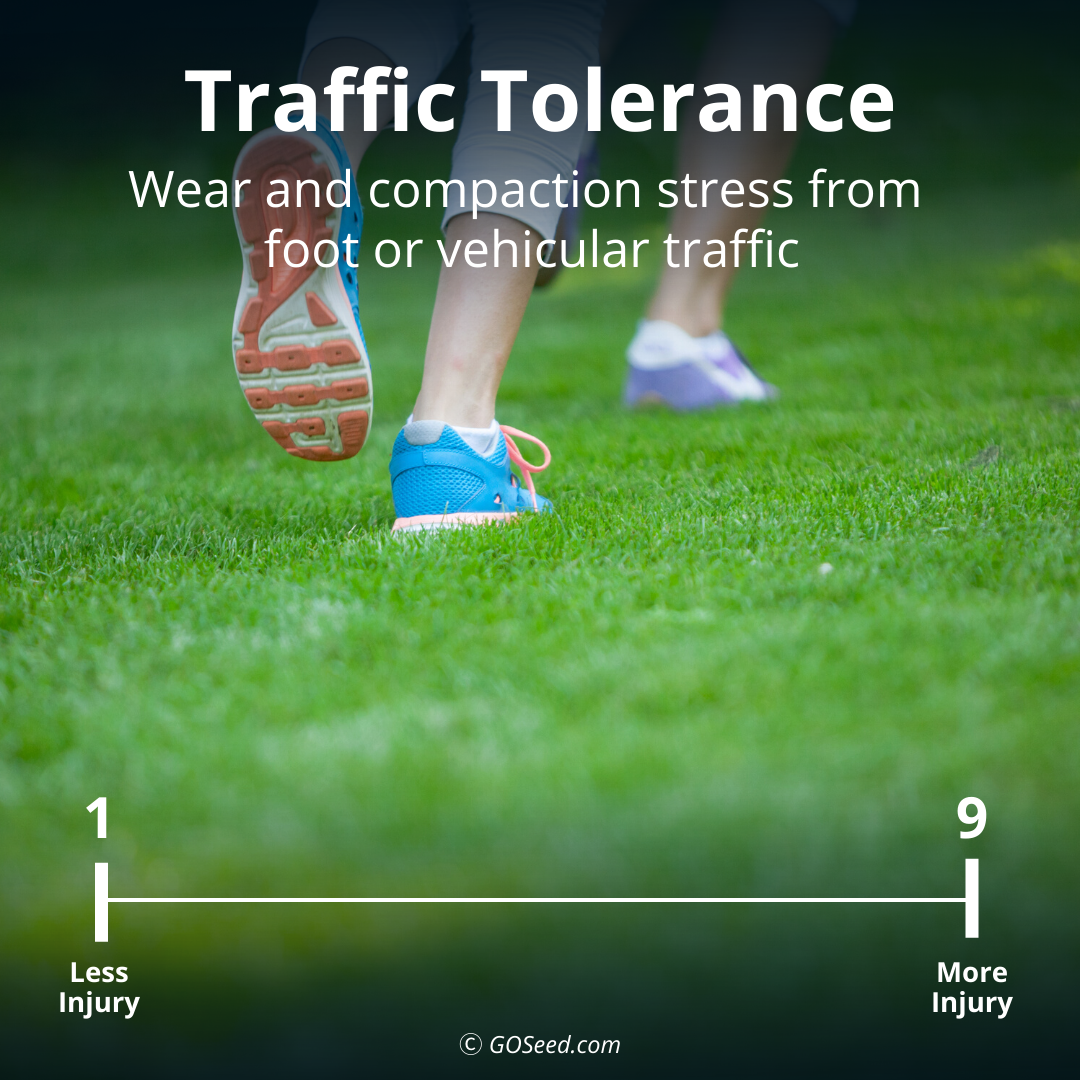
Traffic tolerance
Traffic tolerance is the combination of wear and compaction stress that occurs whenever a turf is exposed to foot or vehicular traffic. Wear injury occurs immediately upon trafficking a turf.
Wear injury symptoms are often expressed within hours and definitely within days. Compaction stress injury is more chronic. It is expressed over time.
The NTEP reports traffic tolerance as visual estimate of turfgrass tolerance using a 1 to 9 rating scale with 1 being no tolerance or 100% injury, and 9 being complete tolerance or no injury.
Traffic tolerance is an important trait for sports fields managers. It also has implications for other user groups such as municipal parks and homeowners that see a lot of foot traffic from people and pets.
*Adapted from A Guide to NTEP Turfgrass Ratings published on NTEP.org